Spectrophotometer Dilution Calculator for absorbance readings
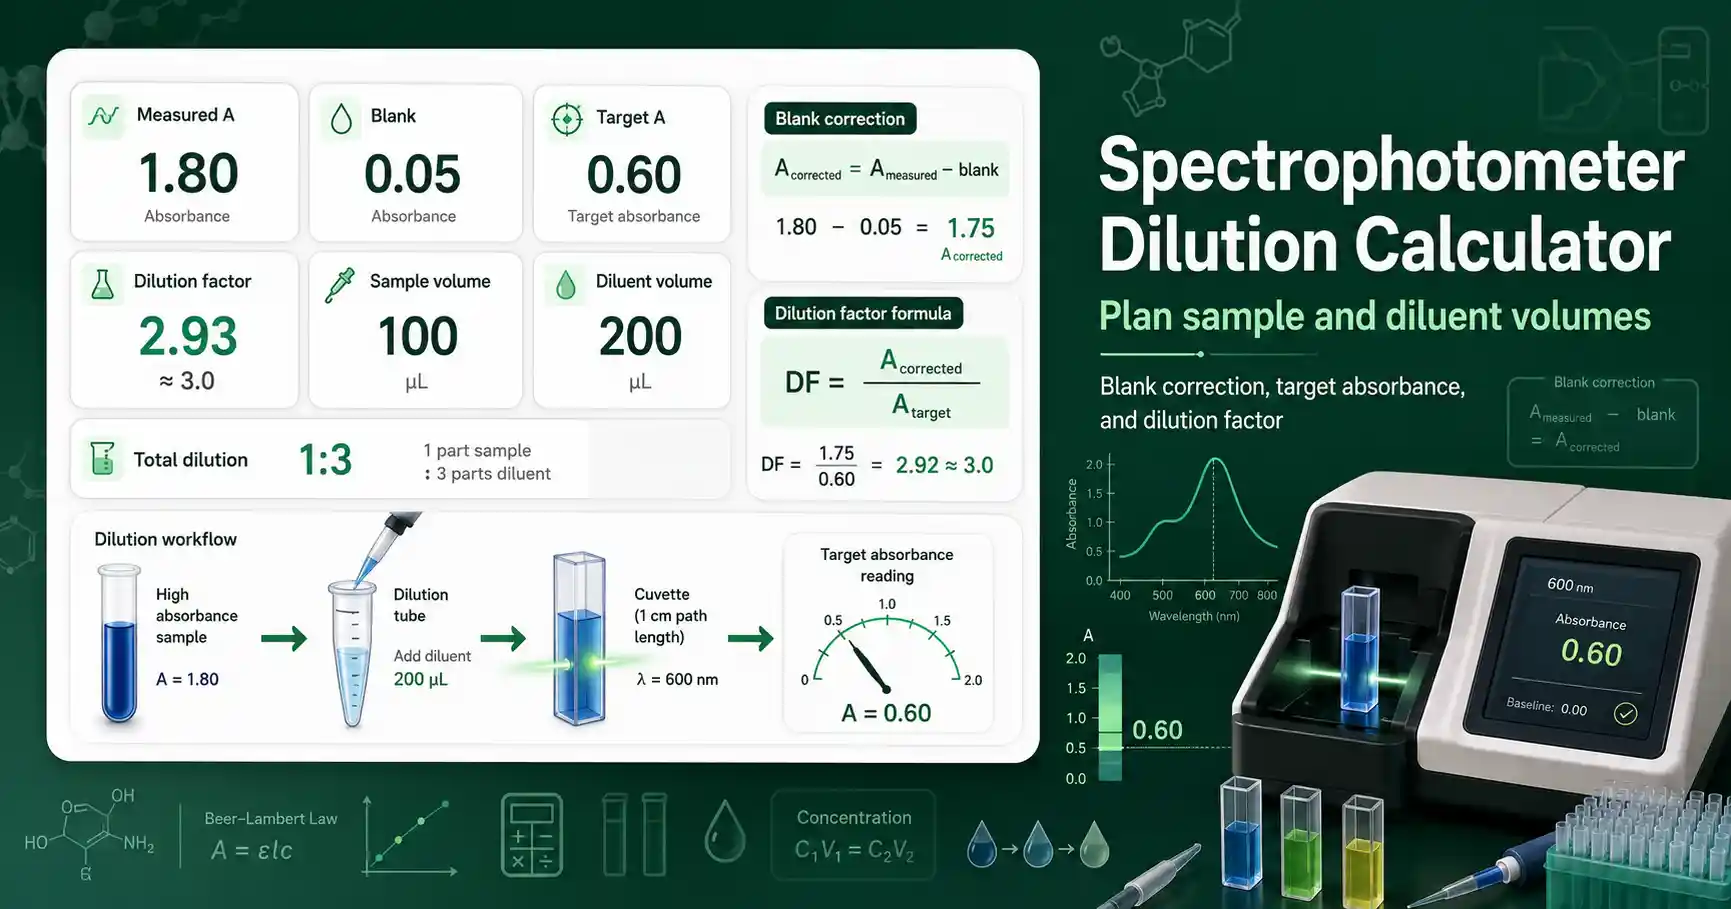
This Spectrophotometer Dilution Calculator helps you decide how much to dilute a sample before taking another absorbance reading. It uses the corrected absorbance, the target absorbance, and the final tube or cuvette volume to estimate a practical dilution plan. The corrected absorbance is the measured sample absorbance minus the blank absorbance. A blank matters because the solvent, buffer, reagent background, and cuvette can add signal that does not belong to the analyte.
The calculator works best when the sample obeys a linear absorbance response. Many teaching labs use a target absorbance near 0.5 because it is high enough to measure and low enough to avoid detector saturation. A value near 1.0 may still be usable for many instruments, but it should be checked against your method and calibration range. A value above the linear range should be diluted before concentration is calculated.
The tool is useful for students learning spectrophotometry, teachers preparing example datasets, lab workers checking routine measurements, and researchers planning repeat reads. It does not identify the compound in the sample. It does not correct for turbidity, scattering, stray light, wavelength mismatch, or chemical interference. It gives a dilution plan that should be verified with the actual instrument and method.
Spectrophotometer Dilution Calculator formula
The main formula is dilution factor = corrected absorbance ÷ target absorbance. This follows the linear idea that absorbance is proportional to concentration over the valid range. If the corrected absorbance is 1.20 and the target absorbance is 0.60, the sample needs a 2-fold additional dilution. The sample volume equals final volume ÷ additional dilution factor. The diluent volume equals final volume minus sample volume.
This calculation is connected to Beer-Lambert behavior, where absorbance increases with concentration for a fixed path length and wavelength. You can review the absorbance-concentration relationship in the Chemistry LibreTexts explanation of the Beer-Lambert Law. If you already know molar absorptivity and path length, the Beer-Lambert Law Calculator can estimate concentration directly. If you have standards and unknowns, a Calibration Curve Calculator is usually the better choice.
Spectrophotometer dilution result interpretation
The additional dilution factor tells you how many times the currently measured sample should be diluted to reach the target corrected absorbance. The total dilution factor includes any dilution already made before the reading. A 5-fold current dilution followed by a 2-fold additional dilution gives a 10-fold total dilution from the original sample. This total factor matters when you back-calculate the original concentration from a diluted measurement.
The sample volume and diluent volume help you make the next tube. For a 1.00 mL final tube and a 4-fold additional dilution, the tool returns 0.25 mL sample and 0.75 mL diluent. For small final volumes, check pipette accuracy before using the suggested volume. A calculated sample volume below about 1 µL is often difficult to pipette reliably with standard lab equipment.
Rounding affects real dilution work. A displayed 3.33-fold dilution may become 30 µL sample plus 70 µL diluent for a 100 µL total volume. That small rounding choice changes the exact dilution slightly. For critical analytical work, record the actual pipetted volumes and use those actual values in the final concentration calculation.
Spectrophotometer dilution worked example
Given values: measured absorbance = 1.35, blank absorbance = 0.05, target corrected absorbance = 0.65, current dilution = 1, final tube volume = 1.00 mL.
Formula: additional dilution factor = (measured absorbance − blank absorbance) ÷ target absorbance.
Substitution: additional dilution factor = (1.35 − 0.05) ÷ 0.65 = 1.30 ÷ 0.65 = 2.00.
Volume calculation: sample volume = 1.00 mL ÷ 2.00 = 0.50 mL, and diluent volume = 1.00 − 0.50 = 0.50 mL.
Interpretation: mix 0.50 mL of sample with 0.50 mL of diluent, then read the diluted sample again. The expected corrected absorbance is close to 0.65 if the response is linear.
Common spectrophotometer dilution mistakes
Do not calculate dilution from the raw absorbance when a blank reading is available. Do not use a target absorbance of zero because dilution cannot reach a zero signal by proportional dilution. Do not assume that a very high absorbance reading remains linear. Do not use a dilution plan if the sample is cloudy, precipitated, or visibly contaminated. Do not compare readings taken at different wavelengths unless the method allows it.
A good result should match the expected chemistry and the instrument range. If a protein assay, dye assay, OD reading, or nucleic acid absorbance falls outside the standard curve, dilute and repeat the reading. If the repeated reading does not scale as expected, the sample may have matrix effects or the instrument may need a method check. Verify critical lab calculations independently before using them in real experiments.