
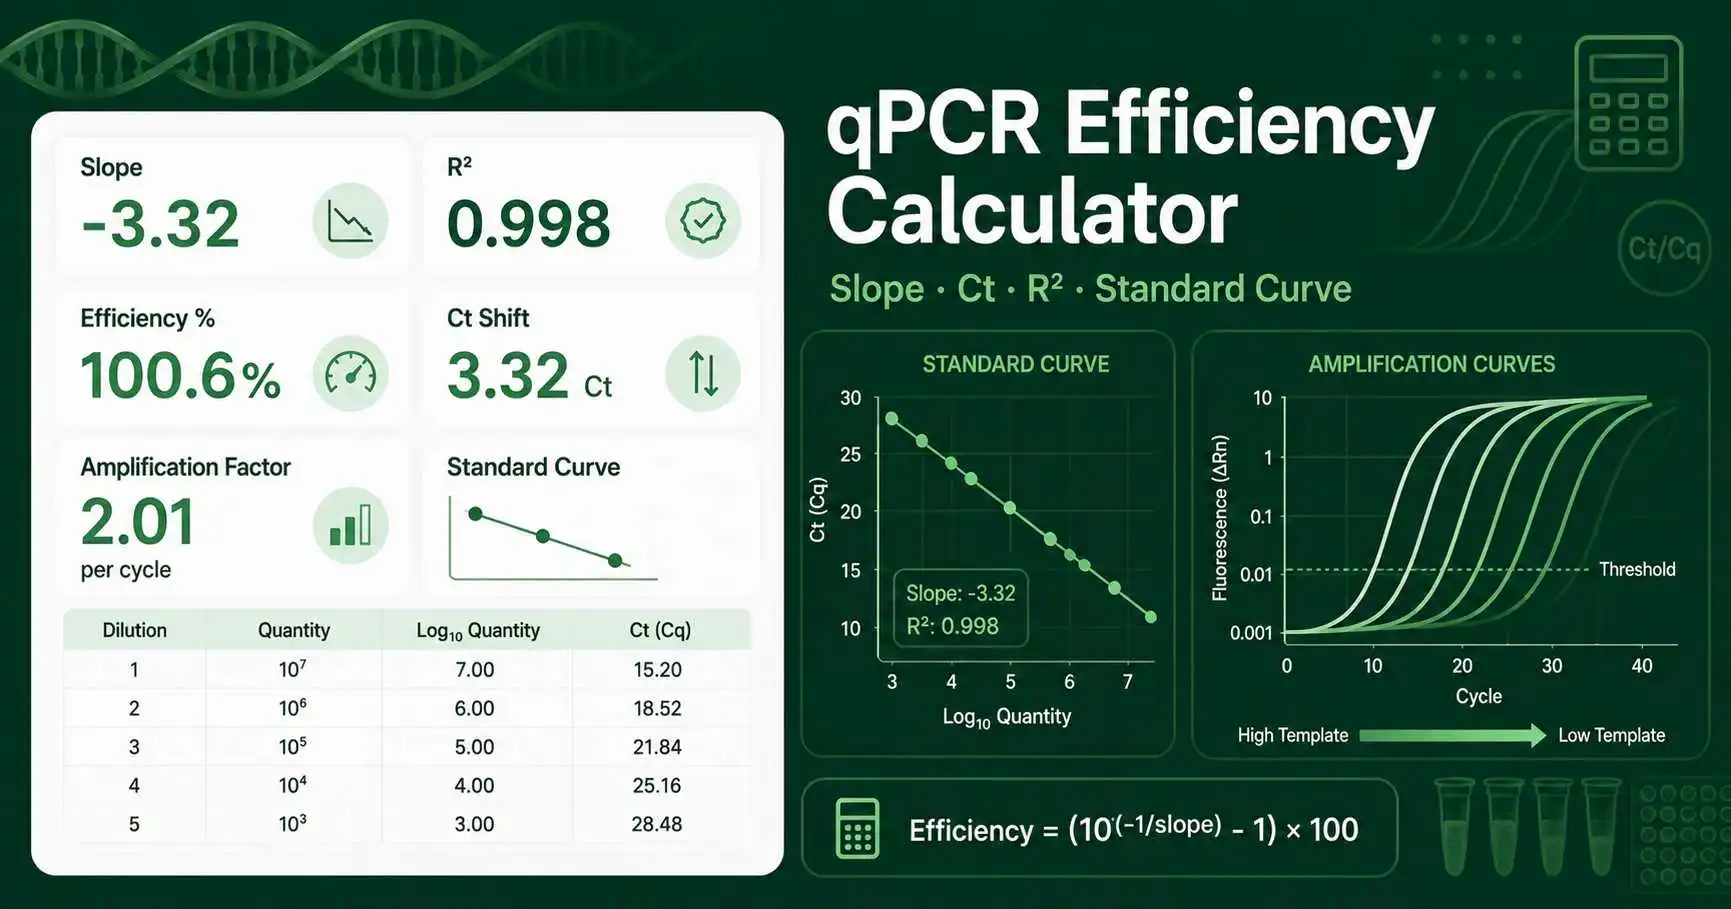
qPCR Efficiency Calculator for standard curves
This qPCR Efficiency Calculator estimates amplification efficiency from a standard curve slope or from two Ct values taken from a dilution pair. It helps you decide whether a qPCR assay amplifies close to the expected rate before you use Ct values for gene expression analysis, copy number estimation, or absolute quantification.
In qPCR, an ideal reaction doubles the target product every cycle. That equals an amplification factor of 2 and an efficiency of 100%. Real assays usually differ because primer design, template quality, inhibitors, pipetting, dilution accuracy, and instrument settings affect amplification.
How to calculate qPCR efficiency from slope
Use the slope from a standard curve where Ct or Cq is plotted against log10 concentration. The calculator uses this equation:
Efficiency % = (10-1/slope - 1) × 100
A slope near -3.322 gives about 100% efficiency. A more negative slope, such as -3.80, gives lower efficiency. A less negative slope, such as -3.05, gives efficiency above 100%, which often needs investigation.
The optional R² input helps you judge the standard curve. A strong standard curve should show good linearity across the dilution series. If R² is low, do not rely on the efficiency value without checking the dilution points and replicate spread.
Worked example using qPCR slope
Suppose your qPCR software gives a standard curve slope of -3.32 and R² of 0.995. The calculator applies the formula: Efficiency % = (10-1/-3.32 - 1) × 100. This gives about 100.4% efficiency.
That result means the assay almost doubles the target each cycle. It looks suitable as an initial screening result. You should still inspect the melt curve, no-template control, standard curve points, and technical replicate variation before using the assay in a real data analysis workflow.
Two-point qPCR efficiency estimate
The two-point method uses Ct values from a concentrated sample and a diluted sample. It is useful when you need a quick teaching example or a rough check from two dilution points. It is not as strong as a full standard curve because one poor dilution or one unstable Ct value can shift the answer.
The calculator uses this equation:
Efficiency % = (dilution factor1/ΔCt - 1) × 100
For a 10-fold dilution, the ideal Ct shift is about 3.32 cycles at 100% efficiency. If a concentrated sample has Ct 18.2 and a 10-fold diluted sample has Ct 21.5, then ΔCt is 3.3. That gives an efficiency close to 101%.
Practical use case: validating a new qPCR primer pair
Use this calculator after you run a serial dilution for a new primer pair. Enter the standard curve slope and R² from your qPCR software. A result near 90–110% suggests the primer pair may be acceptable for early validation, depending on your lab criteria.
If the efficiency is low, check primer concentration, annealing temperature, amplicon length, template quality, and inhibitors. If the efficiency is high, check primer-dimers, nonspecific products, threshold placement, and dilution accuracy. You can compare primer temperature choices with the Annealing Temperature Calculator when optimization is needed.
Practical use case: checking standard curve quality
A qPCR standard curve should not be judged by efficiency alone. Look at the slope, R², replicate Ct spread, and whether all dilution points follow a straight line. One bad high-concentration point or low-concentration point can distort the slope and produce a misleading efficiency value.
This calculator works well with a full dilution workflow. After you create dilution points, use the Standard Curve Calculator to organize regression results, then use qPCR efficiency to interpret the slope in biological terms.
qPCR efficiency values and interpretation
A common practical screening range is 90–110% efficiency. Some labs prefer a narrower range, such as 90–105%, especially for validated diagnostic or publication-quality assays. Follow your protocol, instrument software guidance, and supervisor instructions when the acceptable range is specified.
Bio-Rad explains that a standard curve can be used to determine qPCR efficiency, linear dynamic range, and assay reproducibility, with efficiency and R² used as part of assay quality review. Bio-Rad qPCR assay design and optimization
Common qPCR efficiency problems
Low efficiency can happen when primers bind poorly, the amplicon is too long, inhibitors are present, or the reaction conditions are not optimized. High efficiency can happen when dilution points are inaccurate, nonspecific amplification occurs, primer-dimers contribute fluorescence, or baseline settings distort Ct values.
Do not fix an efficiency problem by changing only one number in the software. Review the raw amplification curves, melt curves, gel result if used, standard dilution preparation, and replicate consistency. The calculator gives a numerical interpretation, but the experiment still needs biological and technical review.
Student and lab reporting notes
Students can use this qPCR efficiency calculator to connect standard curve slope with amplification behavior. Lab workers can use it as a quick independent check when preparing assay validation notes. Researchers can use it while comparing candidate primer pairs before final experimental runs.
In a lab report, state the slope, R², efficiency percentage, dilution range, number of points, and replicate strategy. Also mention whether the assay showed a single melt peak or another specificity check. This gives the reader more useful information than efficiency alone.