Ct Mean Calculator for qPCR data
A Ct Mean Calculator averages replicate Ct or Cq values from real-time PCR. It helps you turn duplicate or triplicate qPCR reactions into one representative value for a target gene, reference gene, standard, or control sample.
The tool calculates the arithmetic mean, sample standard deviation, range, coefficient of variation, and the deviation of each replicate from the mean. These attributes help you judge whether the replicate group is tight enough for reporting or needs review.
How to use Ct Mean Calculator values
Paste your Ct or Cq values into the input box. You can enter one value per line or separate values with commas, spaces, or semicolons. Use only numeric Ct values between 0 and 45. The calculator ignores non-numeric text and flags values outside the common qPCR Ct range.
Use the mean Ct only after checking replicate quality. A clean mean should come from reactions with similar amplification curves, a stable baseline, a correct threshold, and acceptable melt-curve behavior when SYBR Green or another intercalating dye is used.
Ct mean formula and spread calculations
The mean Ct is the sum of all valid Ct values divided by the number of valid replicates. For three replicates, the formula is simple:
mean Ct = (Ct1 + Ct2 + Ct3) ÷ 3
The tool also reports sample standard deviation. SD describes how far the replicate Ct values sit from the mean. The range equals the highest Ct minus the lowest Ct. CV equals SD divided by mean Ct, then multiplied by 100.
Thermo Fisher explains that Ct or Cq values are central to real-time PCR data analysis because they mark the PCR cycle where fluorescence crosses the threshold.Thermo Fisher real-time PCR data analysis
Worked example for mean Ct calculation
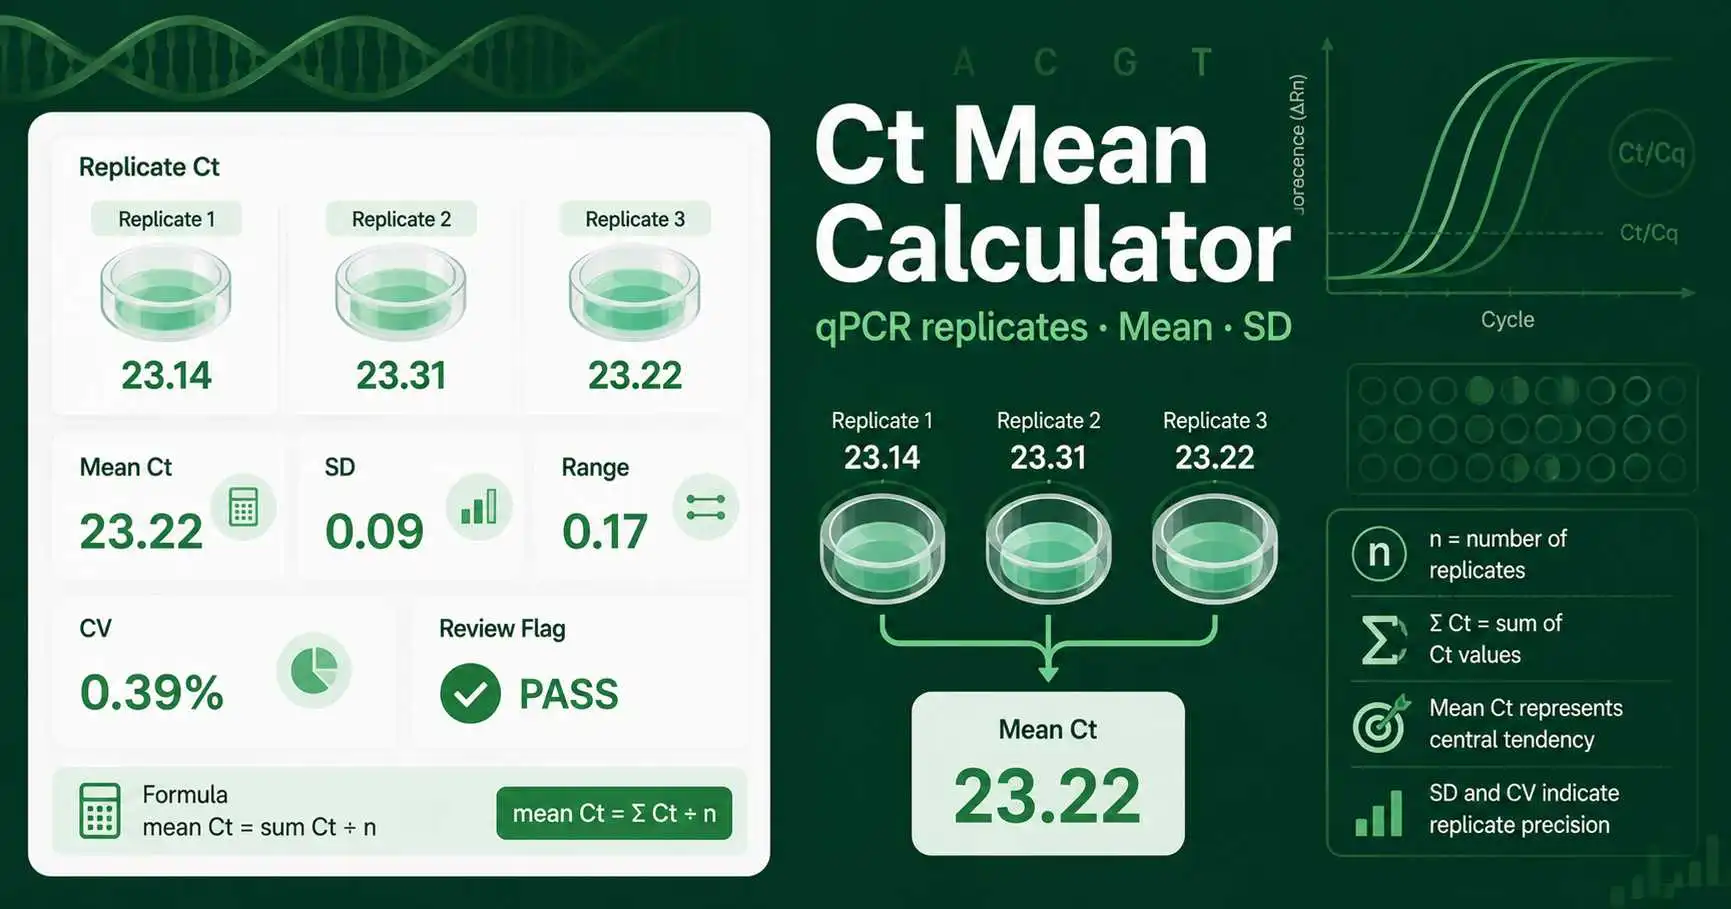
Suppose a qPCR target gene has three technical replicate Ct values: 23.14, 23.31, and 23.22. Add the values first. The total is 69.67. Divide by 3. The mean Ct is 23.223, which you may report as 23.22 or 23.223 depending on your lab style.
The range is 23.31 minus 23.14, which equals 0.17 Ct. That is a tight replicate spread for many routine assays. The SD is also low, so the group is usually suitable for downstream analysis if the amplification curves and controls look clean.
Use case 1: preparing ΔCt analysis
In relative gene expression, you often calculate a mean Ct for a target gene and a mean Ct for a reference gene. Then you calculate ΔCt by subtracting the reference gene mean from the target gene mean. This is why accurate replicate averaging matters.
For example, if the target gene mean Ct is 23.22 and the reference gene mean Ct is 19.80, then ΔCt equals 3.42. You can continue with theDelta Ct Calculator after you check both replicate groups.
Use case 2: reviewing qPCR technical replicates
A lab worker may run triplicate wells for one sample. If the values are 27.10, 27.18, and 27.22, the spread is small. If the values are 27.10, 27.21, and 28.04, the third replicate needs review before the mean is accepted.
A high replicate spread can come from pipetting variation, bubbles, poor sealing, inconsistent template addition, primer-dimer signal, threshold placement, or plate-edge effects. The calculator does not delete outliers. It highlights values that should be checked.
Practical problem before ΔΔCt reporting
Imagine you have a control sample and a treated sample. First, average the target and reference Ct replicates for each sample. Second, calculate ΔCt for each sample. Third, calculate ΔΔCt by subtracting the control ΔCt from the treated ΔCt.
The mean Ct step affects every later value. A single bad replicate can change ΔCt, ΔΔCt, and fold-change interpretation. After replicate review, you can use the Delta Delta Ct Calculator for relative expression analysis.
What a good Ct replicate spread means
A tight spread means the technical reaction setup was consistent. It does not prove that the assay is specific or biologically meaningful. You still need no-template controls, no-reverse-transcription controls where relevant, melt curves, standard curves, and appropriate reference genes.
A wider spread does not always mean the experiment failed. Late Ct values, low-copy targets, weak template input, or borderline detection can create more variation. Review the raw qPCR plot before you decide whether to repeat the reaction or exclude a replicate.
Common mistakes in qPCR Ct averaging
Do not average Ct values from different samples, different primer pairs, different thresholds, or different qPCR runs unless your design and normalization plan allow it. Keep target genes and reference genes separate until the ΔCt step.
Do not round too early. Keep enough decimals while calculating mean Ct, ΔCt, and ΔΔCt. Round the final displayed value according to your lab report, thesis, or publication style.