Analytical chemistry and immunoassay calculator
ELISA Standard Curve Calculator
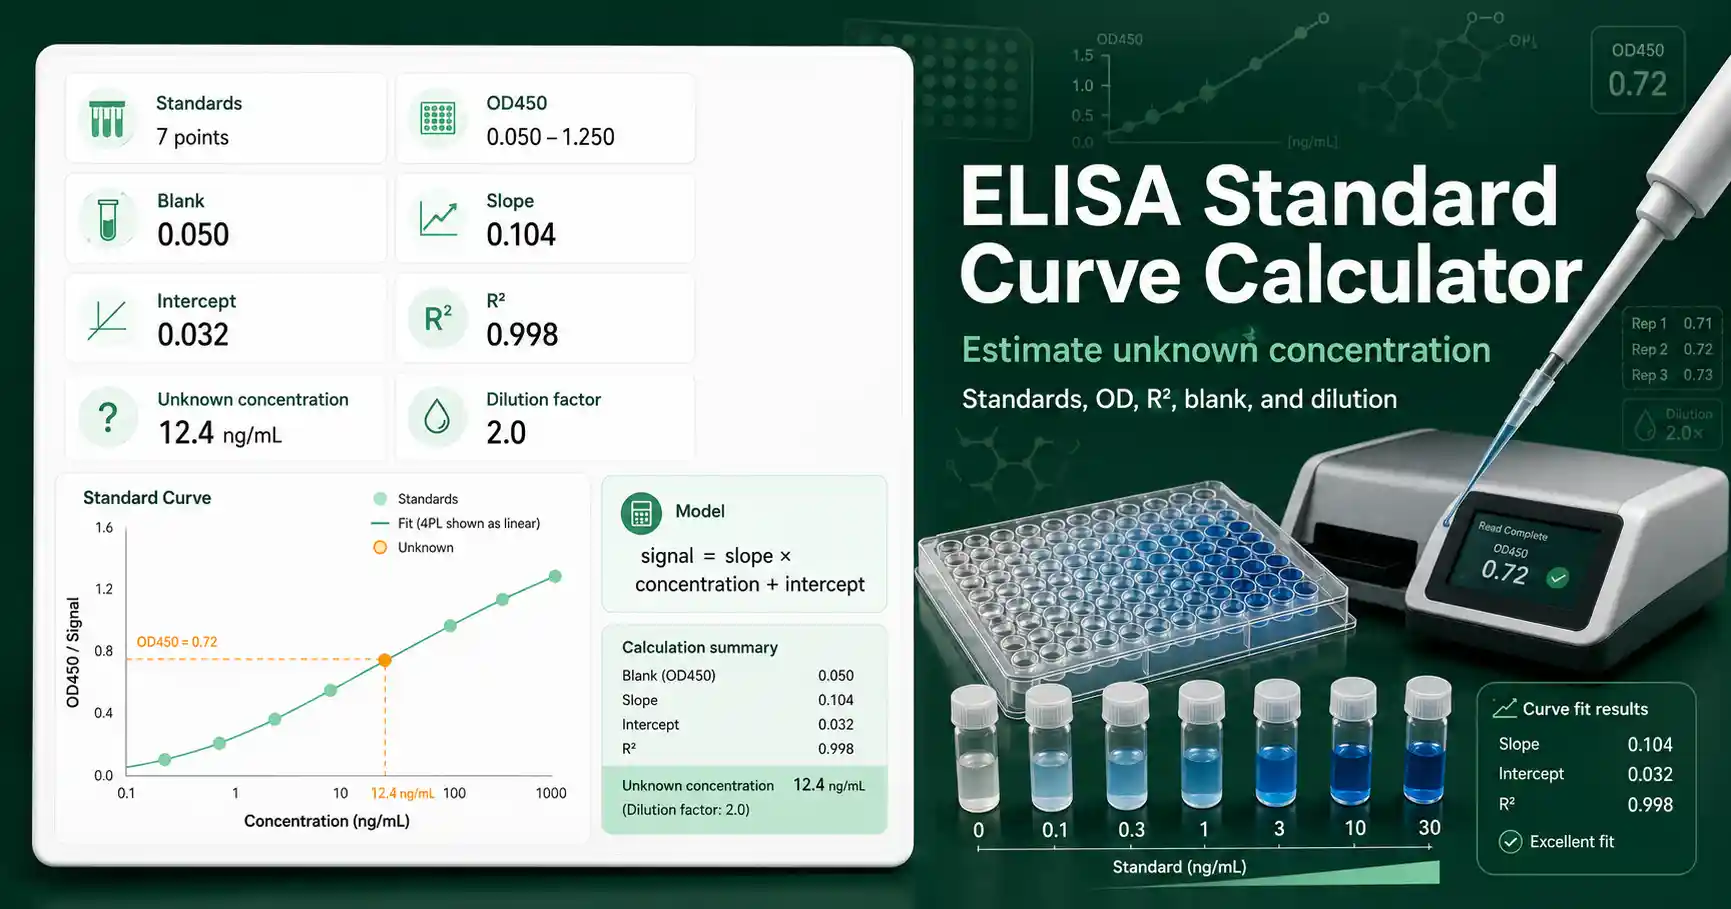
Use this ELISA standard curve calculator to fit standards, calculate slope, intercept, and R², and estimate an unknown sample concentration from optical density readings.
ELISA plate reader math
ELISA standard curve calculator
Enter standards and unknown optical density readings to fit a simple ELISA standard curve and estimate the sample concentration.
Use one standard per line. Separate concentration and absorbance with a comma, tab, or space.
Enter one value or replicate values separated by commas.
Subtracts background from standards and samples.
Use 1 for undiluted samples.
Examples: pg/mL, ng/mL, µg/mL, IU/mL.
Standard curve fit
Slope0.00652187
Intercept0.0251887
R²0.99793
Standards used6
Curve range: 0 to 250 pg/mL. Verify critical lab calculations independently before using them in real experiments.
ELISA Standard Curve Calculator for unknown samples
This calculator turns ELISA plate reader signals into concentration estimates by fitting known standards first. It accepts standard concentration and optical density pairs, then calculates the best-fit line for the selected model. It also subtracts a blank reading when you provide one. Blank subtraction matters because ELISA wells often contain background absorbance from reagents, plate material, or nonspecific signal. The calculator then applies the fitted curve to the unknown sample signal. If the unknown sample was diluted before loading, the calculator multiplies the curve concentration by the dilution factor.
The tool is useful for students learning ELISA data analysis, teachers demonstrating calibration curves, and lab workers checking spreadsheet calculations. Researchers can use it as a fast independent check before moving results into a report or notebook. It is best for simple linear or log-concentration curve checks. Many commercial ELISA kits use four-parameter logistic or five-parameter logistic fitting for final analysis. This calculator does not replace validated plate reader software when the assay requires a logistic curve. It gives a transparent result that shows the slope, intercept, R², corrected sample signal, and final concentration.
ELISA standard curve formula and assumptions
In linear mode, the calculator uses the equation signal = slope × concentration + intercept. It estimates the unknown concentration by rearranging the equation to concentration = (signal − intercept) ÷ slope. In log concentration mode, it fits signal against log10 concentration. Log concentration mode can be helpful when a narrow part of a sigmoidal ELISA response looks more linear on a log concentration axis. The zero standard cannot be used in log concentration fitting because log10(0) is undefined. The calculator warns you when the unknown signal falls outside the standard range. A sample outside the standard range should usually be diluted, concentrated, or rerun with a better standard range.
Standards should bracket the unknown sample whenever possible. A good standard curve has standards spread across the expected sample range. Replicate wells help reveal pipetting variation and plate effects. A high R² value supports a simple linear fit, but it does not prove that the assay is valid. A curve can have a good R² and still be unsuitable if the unknown lies outside the calibrated range. For broader calibration workflows, compare this page with the Calibration Curve Calculator. For sensitivity checks after a curve is established, the Limit of Detection Calculator may be a useful next step.
ELISA data are commonly interpreted by comparing unknown optical density values with a standard curve made from known analyte concentrations. Bio-Rad explains that known antigen concentrations can be used to produce a standard curve, and that sample dilution must be adjusted during calculation. You can review that background in Bio-Rad's ELISA results guide. Always follow the instructions for the specific ELISA kit, wavelength, blank wells, incubation timing, and curve model. Verify critical lab calculations independently before using them in real experiments.
ELISA Standard Curve Calculator worked example
Suppose an ELISA plate has standards of 0, 15.6, 31.25, 62.5, 125, and 250 pg/mL. The corresponding signals are 0.05, 0.16, 0.28, 0.51, 0.93, and 1.68. The blank is 0.05, so each standard and unknown reading is corrected by subtracting 0.05. An unknown sample gives duplicate readings of 0.74 and 0.77. The mean raw signal is 0.755, and the mean blank-corrected signal is 0.705. If the fitted linear equation is signal = 0.0065 × concentration + 0.012, the curve concentration is about 106.6 pg/mL. If the unknown was diluted 2-fold before loading, the final sample concentration is about 213.2 pg/mL. The interpretation is that the original sample contains about 213 pg/mL under this assay curve and dilution factor. Report the value with sensible rounding because ELISA precision depends on replicate quality, kit performance, and the fit model.
Lab Questions About ELISA Standard Curves
What does an ELISA standard curve calculator do?
It fits known ELISA standards and uses the fitted equation to estimate the concentration of an unknown sample from its optical density reading.
Should I subtract the ELISA blank first?
Yes. Blank correction removes background signal from standards and samples before the curve is fitted and before unknown samples are interpolated.
Can this replace ELISA software?
No. It is a useful educational and checking tool, but critical ELISA results should be reviewed against the kit instructions and validated analysis software.