Relative Standard Deviation Calculator for replicate precision
This Relative Standard Deviation Calculator converts a list of replicate measurements into a precision summary. It reports the mean, sample standard deviation, population standard deviation, RSD percent, minimum, maximum, range, and median. RSD is also called the coefficient of variation in many statistics and analytical chemistry contexts. It tells you how large the spread is relative to the average signal or concentration. A small RSD means the values cluster closely around the mean. A large RSD means the values vary more than expected for the method or sample type.
Students can use the calculator to check homework problems about mean, standard deviation, and relative variation. Teachers can use it to create fast examples for precision, repeatability, and analytical uncertainty. Lab workers can use it to summarize absorbance readings, concentration replicates, plate counts, standard curve checks, and quality control measurements. Researchers can use it for quick screening of replicate consistency before moving results into a spreadsheet, lab notebook, or report.
The tool accepts values separated by commas, spaces, semicolons, or new lines. The unit label does not change the calculation because RSD is a percentage. The label simply makes the mean, standard deviation, and range easier to read. You can enter absorbance units, mg/L, µM, ng/µL, CFU/mL, enzyme activity units, or any other numeric measurement unit. You should keep all entered values in the same unit before calculating RSD.
Relative Standard Deviation Calculator formula
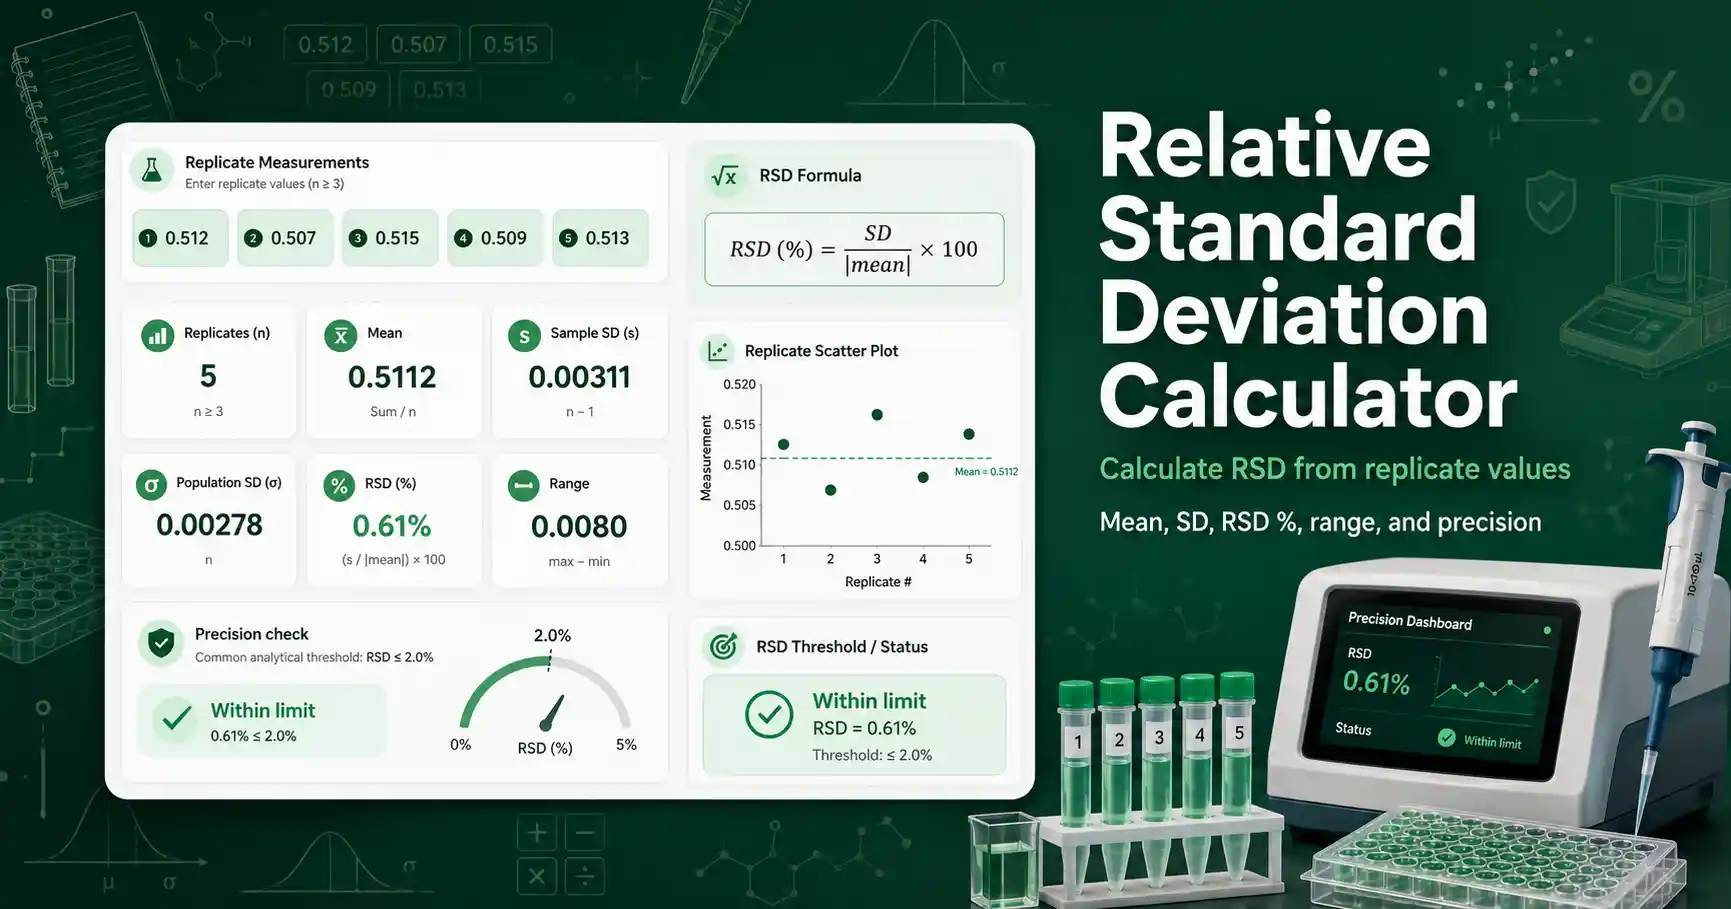
The calculator first computes the arithmetic mean. It then calculates the standard deviation from the replicate values. For most lab replicates, the sample standard deviation is the better default because the entered values represent a sample of repeated measurements. Population standard deviation is also shown because some teaching problems define the data set as the complete population.
Sample SD = √(Σ(x − mean)² / (n − 1))
RSD (%) = sample SD / |mean| × 100
The absolute value of the mean is used in the denominator so the RSD percent stays positive when the mean is negative. RSD cannot be calculated when the mean is zero. A zero mean makes the formula undefined because the calculation divides by the mean. The calculator blocks that case instead of showing an impossible result.
A common analytical chemistry interpretation is simple. Lower RSD means better repeatability. Higher RSD means the replicates are less precise. The acceptable RSD depends on the instrument, analyte level, sample matrix, and method validation rules. A 1% RSD may be excellent for a stable absorbance reading. A 10% RSD may still be understandable for low-level biological replicates or noisy near-limit measurements.
Relative standard deviation is useful because standard deviation alone has the same unit as the measurement. A standard deviation of 0.2 mg/L means something different when the mean is 1 mg/L compared with 100 mg/L. RSD normalizes the spread to the mean, so two data sets with different scales can be compared more fairly. Chemistry LibreTexts explains relative standard deviation as a useful way to compare data sets when their means differ: characterizing measurements and results.
How to interpret RSD percent in lab measurements
RSD is a precision statistic, not an accuracy statistic. A set of replicate measurements can have a low RSD and still be biased if the calibration, blank correction, or reference value is wrong. Use RSD to judge repeatability, then use recovery, calibration checks, or reference materials to judge accuracy. If you need to compare RSD with mean concentration, the Sample Mean Calculator can help isolate the average calculation. If one value looks suspicious, the Outlier Checker can help you review it before deciding whether to keep or exclude it.
RSD can rise for several practical reasons. Pipetting variation increases spread when small volumes are used. Instrument drift can change signals across a run. Poor mixing can make aliquots inconsistent. Matrix effects can change recovery between replicates. Values close to a detection limit often show higher relative variation because the mean is small.
Rounding matters because RSD is built from both the mean and the standard deviation. Keep enough digits during calculation and round the final value for reporting. For many educational examples, one to three decimal places for RSD is enough. For method validation work, follow the reporting format used by your laboratory or course instructions. Verify critical lab calculations independently before using them in real experiments.