Lowry Assay Calculator for protein concentration
The Lowry Assay Calculator estimates protein concentration from absorbance readings produced by the Lowry protein assay. It works with sample replicates, a blank value, a dilution factor, and standard curve data. The calculator reports the measured assay concentration and the estimated concentration in the original sample. It also converts the final result into µg/mL, mg/mL, and µg/µL for common lab workflows.
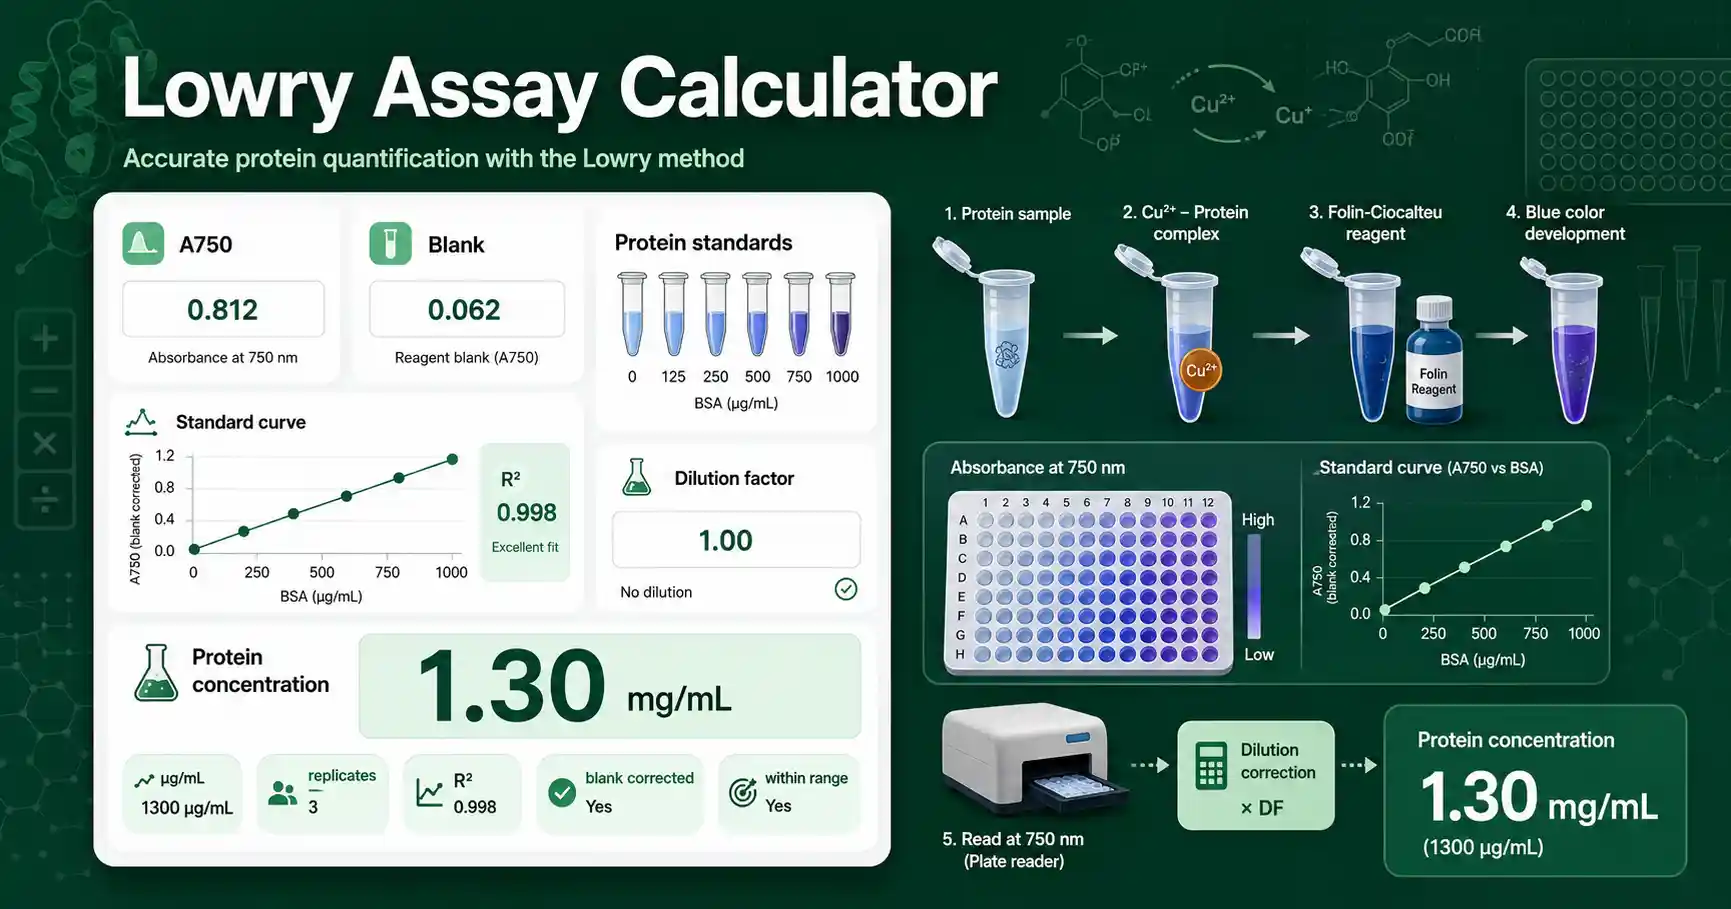
The Lowry method uses copper under alkaline conditions and then develops color with Folin-Ciocalteu reagent. Protein standards create the calibration curve that connects absorbance to concentration. The tool does not replace the assay itself. It helps you calculate the result after you have prepared standards, read the absorbance, and checked that the curve behaves as expected.
Lowry assay inputs needed before calculation
You need at least one sample absorbance reading. Replicate readings are better because they reveal pipetting variation, tube mixing variation, and timing differences. You also need a reagent blank, usually buffer and reagents without protein. The blank removes background color from the assay chemistry and sample buffer. If your instrument already subtracted the blank, enter 0 as the blank value.
The calculator accepts standard concentrations in µg/mL and absorbance values in a simple two-column format. It fits a linear standard curve and returns the slope, intercept, and R². You can also enter a manual curve equation from spreadsheet software or plate reader software. For another colorimetric protein method, compare this workflow with the Bradford Assay Calculator.
Lowry Assay Calculator formula
The calculator first averages the sample absorbance readings. It subtracts the blank to obtain the blank-corrected absorbance. When a fitted curve is used, it applies the equation absorbance = slope × concentration + intercept. It rearranges that equation to concentration = (blank-corrected absorbance − intercept) ÷ slope. It then multiplies by the dilution factor to estimate the original protein concentration.
This formula assumes that the sample falls within the linear part of the standard curve. It also assumes that standards and samples were treated with the same reagent volumes, incubation time, wavelength, and temperature conditions. The result becomes less reliable when a sample reads above the highest standard or below the lowest standard. The calculator flags those cases when you use the standards table mode.
Lowry Assay Calculator worked example
Suppose a diluted protein sample gives Lowry absorbance readings of 0.516, 0.523, and 0.519. The reagent blank is 0.035. A standard curve gives a slope of 0.00112 absorbance units per µg/mL with an intercept of 0. The sample was diluted 1:3 before the assay, so the dilution factor is 3.
The mean sample absorbance is 0.519. The blank-corrected absorbance is 0.519 − 0.035 = 0.484. The measured assay concentration is 0.484 ÷ 0.00112 = 432.1 µg/mL. The original sample concentration is 432.1 × 3 = 1296.3 µg/mL. That is about 1.30 mg/mL. This means the undiluted sample contains about 1.30 micrograms of protein per microliter.
How to interpret Lowry protein assay results
A result inside the standard curve range is usually easier to trust. A sample above the highest standard should be diluted and measured again. A sample below the lowest standard may need a more concentrated sample, a different assay range, or a more sensitive method. R² helps you judge whether the standards follow a straight line, but it does not catch every experimental problem.
Lowry assays can be affected by buffer composition, reducing agents, detergents, chelators, phenols, and timing differences. You should use standards prepared in a matrix that matches the sample as closely as possible. You should also read standards and samples at the same endpoint time. The original Lowry protein method is documented in the classic protein measurement paper, and many modern kits adapt the same principle with protocol-specific conditions.
When students and lab workers use this calculator
Students can use this calculator to learn how a standard curve converts absorbance into concentration. Teachers can use it to show why blank correction and dilution correction are separate steps. Lab workers can use it when preparing equal protein amounts for SDS-PAGE, western blotting, enzyme assays, or binding assays. Researchers can use it to compare replicate readings before deciding whether to repeat a sample.
The calculator is most useful after you have collected absorbance values but before you prepare downstream samples. It can help you avoid mistakes such as forgetting the dilution factor, mixing mg/mL and µg/mL, or using the wrong curve intercept. It also estimates the total protein added to the assay when you enter the sample volume. For workflows that start from absorbance and extinction coefficient instead of a colorimetric curve, use a direct protein concentration calculation.
Common mistakes in Lowry assay calculations
Do not use a standard curve made with a different wavelength, reagent volume, or incubation time unless your protocol says it is acceptable. Do not apply a dilution factor twice. Do not enter a 1:5 dilution as 0.2 when the calculator asks for dilution factor. Use 5 for a 1:5 dilution. Do not trust a concentration that is outside the standard curve without rerunning the sample in range.
Avoid comparing Lowry results across very different buffers without matrix-matched standards. Avoid using cloudy samples because turbidity can raise absorbance. Avoid using standards that have been stored too long or mixed poorly. Verify critical lab calculations independently before using them in real experiments.