Replicate Calculator for lab measurements
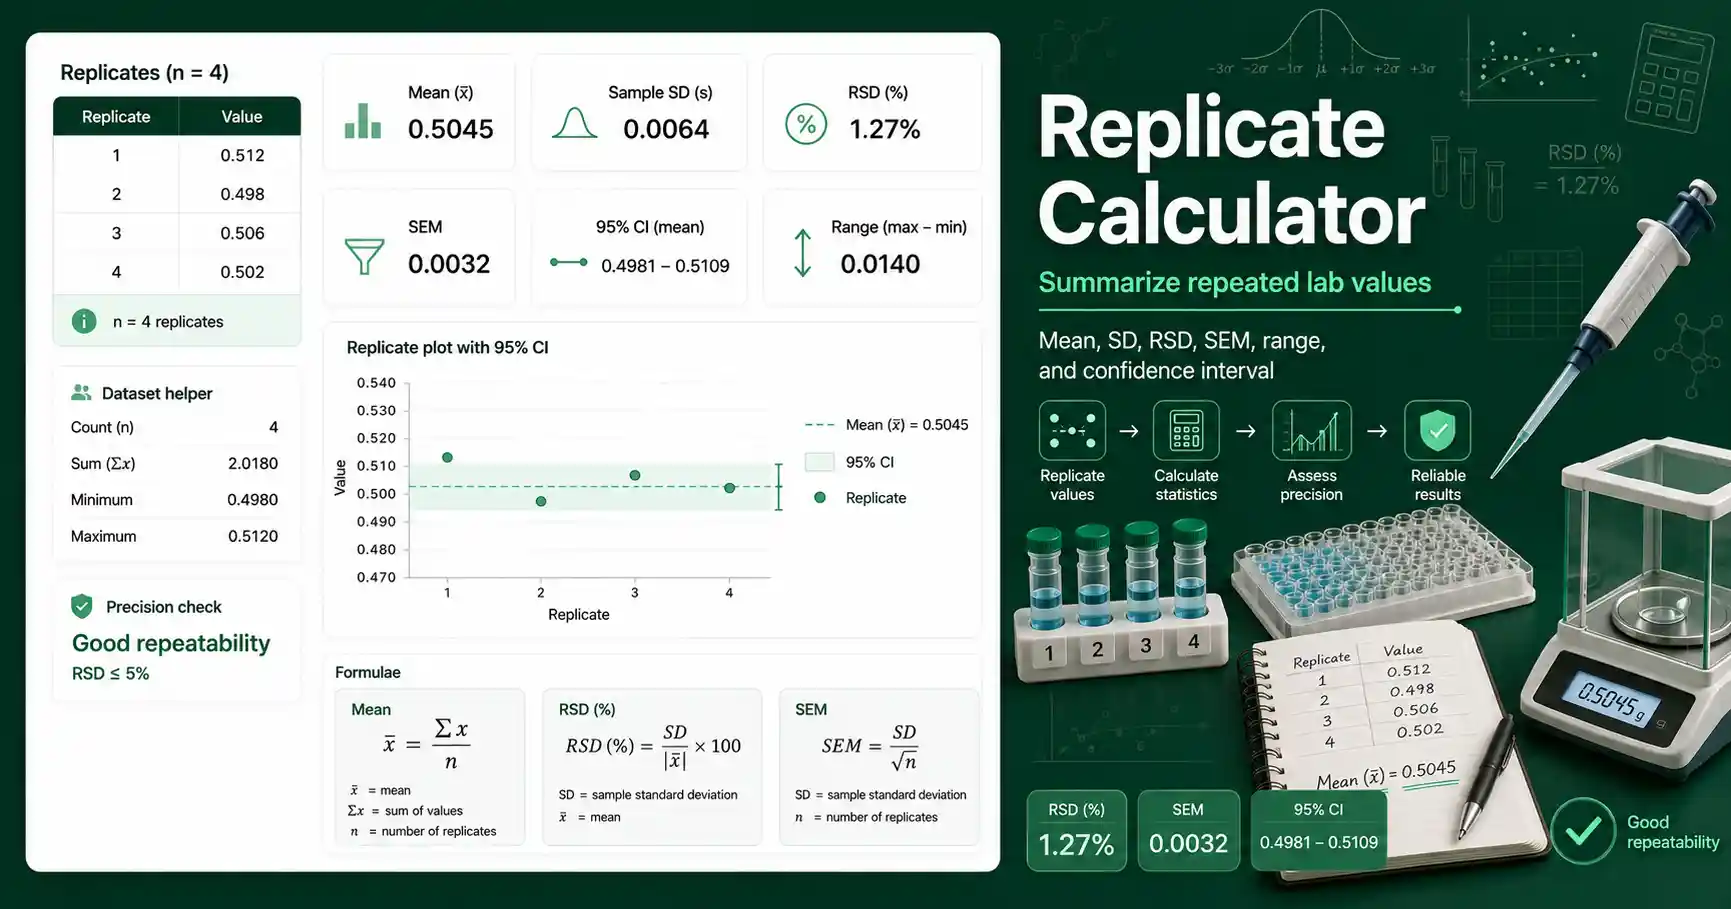
This Replicate Calculator helps you summarize repeated measurements from chemistry, biochemistry, molecular biology, microbiology, and teaching labs. It accepts values from a notebook, spreadsheet, instrument export, or copied table. The calculator reports the number of replicates, mean, median, standard deviation, relative standard deviation, standard error of the mean, 95% confidence interval, minimum, maximum, and range.
Replicates matter because a single measurement can hide random error. Three absorbance readings of 0.412, 0.418, and 0.409 tell a better story than one reading alone. The mean gives the central value. The standard deviation shows how spread out the readings are. The RSD expresses that spread as a percentage of the mean, which makes precision easier to compare between methods.
Students can use this tool to check homework datasets and lab-report tables. Teachers can use it to demonstrate how repeated measurements improve confidence in a result. Lab workers can use it for quick method checks, plate-reader replicates, pipetting practice, titration results, concentration readings, and assay repeats. Researchers can use it to prepare a clean first-pass summary before moving data into a larger statistical workflow.
Replicate Calculator formula and result meaning
The mean is calculated as the sum of all replicate values divided by the number of values. The sample standard deviation uses n minus 1 in the denominator because replicate data usually estimate variability from a sample rather than from a whole population. The RSD is calculated as sample standard deviation divided by the absolute mean, then multiplied by 100. The SEM is calculated as sample standard deviation divided by the square root of n. A 95% confidence interval estimates a likely range for the true mean using a t critical value and the SEM.
A small standard deviation means the readings sit close together. A large standard deviation means the readings vary more. A low RSD often suggests good repeatability, but acceptable RSD depends on the method, instrument, sample type, and concentration range. A result near a detection limit can have a higher RSD than a result in the middle of a calibration range. The range shows the distance between the highest and lowest replicate. The median helps when one value is different from the rest.
Use the Relative Standard Deviation Calculator when RSD is the main precision metric you need. Use the Outlier Checker when one replicate looks unusual and you need a structured screen before deciding how to report it. For background on measurement uncertainty and data quality, Chemistry LibreTexts has a useful overview of characterizing analytical measurements.
How to enter replicate values correctly
Paste one value per line, or separate values with commas, spaces, tabs, or semicolons. Keep all values in the same unit before calculating. Do not mix mg/mL with µg/mL unless you convert them first. Do not mix raw absorbance with corrected absorbance in the same dataset. If you blank-corrected one replicate, blank-correct all matching replicates. If you diluted one replicate differently, convert it back to the same final unit before entering it.
The calculator does not decide whether a method passed or failed. It gives a statistical summary that you can compare with your classroom rubric, lab SOP, assay validation rule, or instrument method note. Verify critical lab calculations independently before using them in real experiments.
Replicate Calculator worked example
Given values: 12.4, 12.7, 12.5, and 12.6 mg/L. The number of replicates is 4. The mean is calculated as (12.4 + 12.7 + 12.5 + 12.6) ÷ 4. The result is 12.55 mg/L. The sample standard deviation is about 0.129 mg/L. The RSD is 0.129 ÷ 12.55 × 100, which is about 1.03%. The SEM is 0.129 ÷ √4, which is about 0.065 mg/L.
Interpretation: the four replicate values are close to the mean, so the precision looks strong for a routine lab dataset. The RSD of about 1.03% means the standard deviation is only about one percent of the average value. If your method accepts an RSD below 5%, this set would meet that precision criterion. If your method requires tighter agreement, you should compare the result with that specific rule instead of using a generic threshold.
Common replicate calculation mistakes
The most common mistake is mixing units in the same input list. Another mistake is averaging values before applying dilution correction. Correct the values first, then calculate replicate statistics. Some users remove a high or low value too quickly. A replicate should only be excluded for a defensible reason, such as a documented pipetting error, instrument issue, contamination, or a justified statistical rule. Rounding too early can also change small datasets. Keep extra digits during calculation and round the final reported result according to your lab-report format.